


Like many organizations, we here at Spectro Cloud are exploring how Artificial Intelligence (AI) can help our teams be more productive and improve the experience we give our customers.
One clear barrier emerges time and again: agentic development can be challenging to debug and analyze due to the ‘black box’ nature of this technology. In fact, as an industry we struggle to audit the decision-making process of agentic workflows.
But that doesn’t mean we shrug and give up. We hold ourselves to high expectations and standards here at Spectro Cloud!
For us to release an AI capability in our product, we must first have a deep understanding of how the AI is behaving and attempt to answer critical questions such as “Why did it choose that tool? Why did it take that action? What information did it have at that point in time?” and so on. Only through the understanding of behavioral questions can we produce agentic solutions that provide value — and reliability.
To help fellow builders and those pursuing agentic workflows, this blog shares how we’re working to improve our understanding of agentic workflows through observability (O11y), using an example AI application to debug an incorrect output.
Open-source FTW
Commercial platforms exist that provide you with built-in capabilities to ease the development of agentic workflows, which may include observability out of the box.
However, not all agentic development platforms offer the same amount of information, and you sometimes have to stitch things together yourself to understand what’s really happening. One open-source solution we stumbled upon early in our journey to building an understanding of our agentic workflows was Arize Phoenix.
Phoenix is an observability platform focusing on helping builders answer questions related to their AI applications. Getting started is easy: with a single Docker command, you can start and stand up the observability platform.
docker run --rm -p 6006:6006 --name phoenix arizephoenix/phoenix:latest
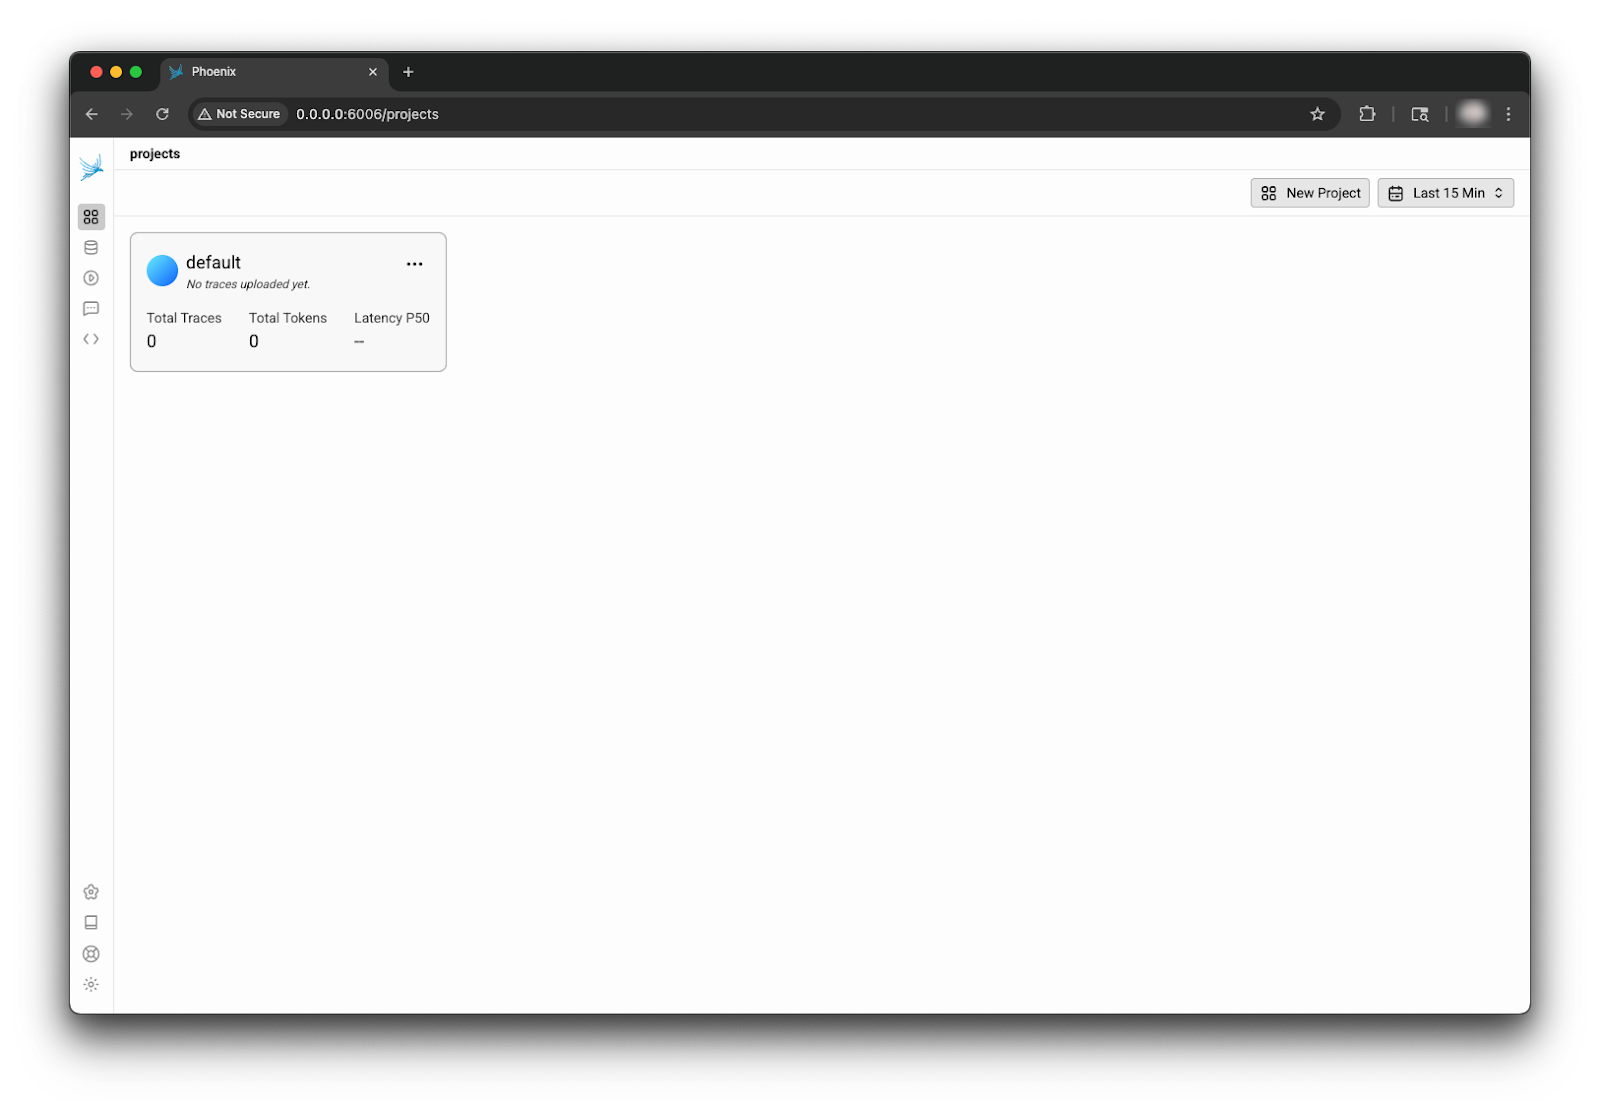
Once the container is ready, you can access the Phoenix dashboard and view traces. Below is an image of a freshly initialized Phoenix dashboard hosted on localhost port 6006.
Enabling tracing
Depending on your agentic framework (assuming you are using a framework), Phoenix supports many integrations that let you get started in seconds with a few one-liners. Check out its integrations page to view all supported integrations.
If you are not using a framework, you can use the SDK to focus on tracing calls to the LLM. You can also add custom functions to define the start and stop of tracing spans. We prefer the latter, as we can inject richer context into the span data by managing the span lifecycle ourselves, but that’s a bit more advanced.
Using the Smolagents framework as an example, the steps to get started are:
- Install the required Python dependencies.
pip install arize-phoenix-otel && \
pip install openinference-instrumentation-smolagents smolagents- Point to where Phoenix is listening, such as localhost:6006. The code snippet below would go into your LLM application.
import os
os.environ["PHOENIX_COLLECTOR_ENDPOINT"] = "http://localhost:6006"- Register the instrumentation in your Smolagent LLM application.
from phoenix.otel import register

tracer_provider = register(
 project_name="my-llm-app", # Default is 'default'
 auto_instrument=True
)
That wraps up the steps to get started with Smolagents. There are many more customization options available and advanced features you can enable. The main point to take away from the example is that enabling tracing can be done very quickly, especially if the integration use case you are using has first-class support.
Making sense of a trace
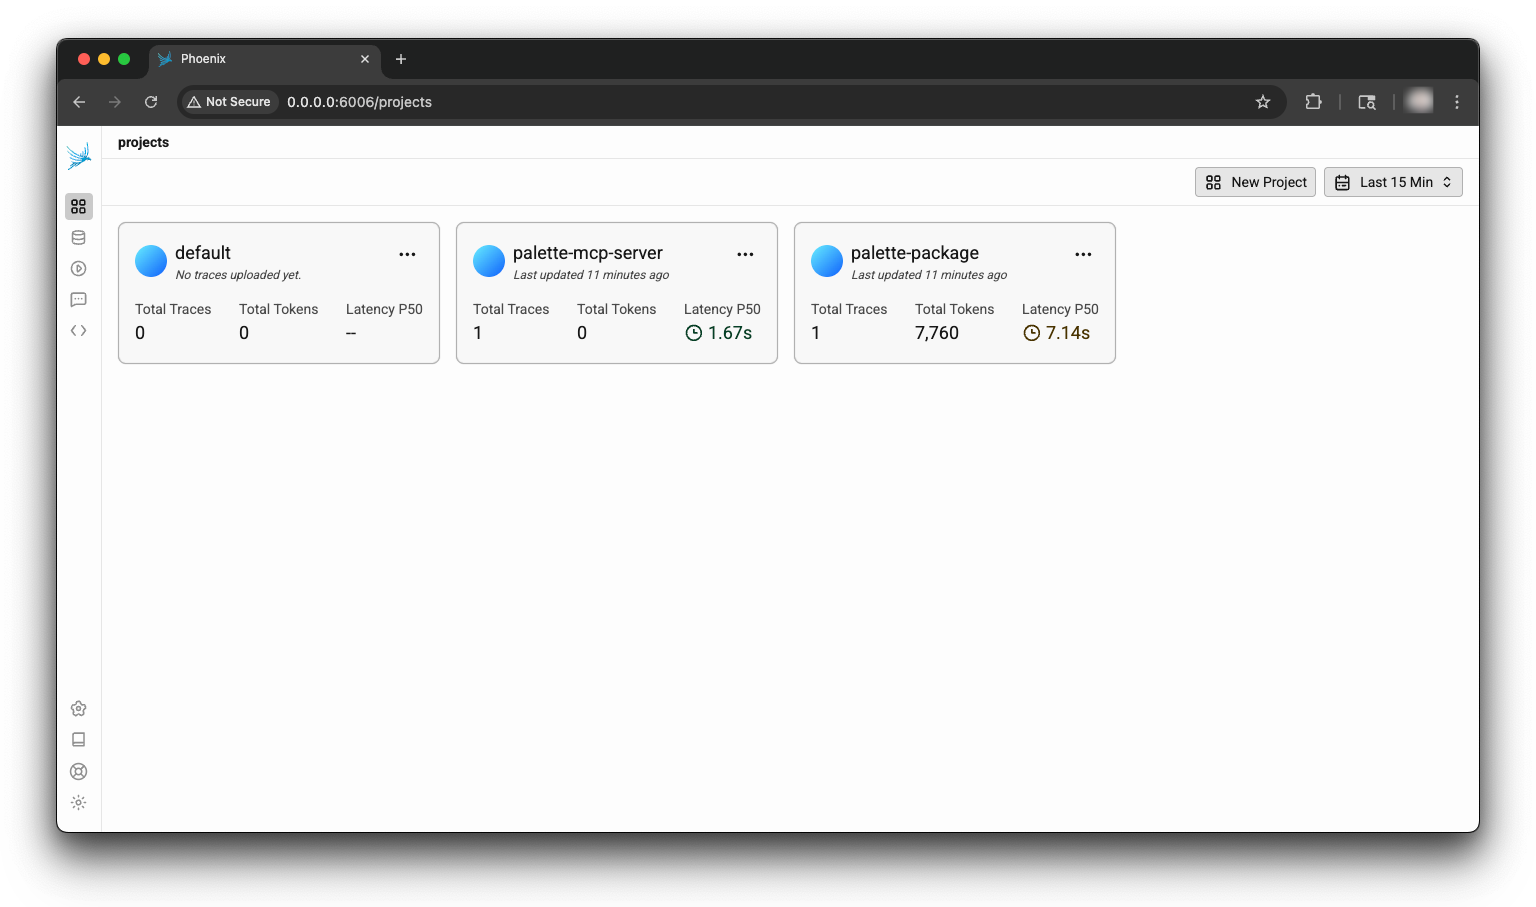
Curious readers may wonder at this point what a trace looks like. What information can we glean from a trace? To answer this question, we’ll use an example application using smolagents called “palette-package” with access to an example Model Context Protocol (MCP) server called “palette-mcp”. Assume both the LMM application and the MCP server have been configured to use Phoenix. Below is the view from the Phoenix dashboard.
To kick things off, in this example application, assume we fired off a prompt asking “Do I have any active Kubernetes clusters?”. The expected order of operations is for the application to process the query, leverage any tool calls, if available, and return a reply to the user. The MCP server in this example has a single tool function named getActiveClusters. The expectation is that the LLM agent will use the function to call to determine if there are any active clusters in the project.
The application replied with the following answer.
{
    "data": "You do not have any active Kubernetes clusters in your project."
}
This is unexpected, as the correct answer is two active clusters in the project of interest. Where in the process could things have gone wrong? The list can be quite exhaustive for any application, especially if multiple tool function calls are expected. The first set of questions that should be answered are:
- Did the tool return incorrect data?
- Did the MCP register correctly?
- Did the agent parse the data incorrectly from a tool call?
- Was something misconfigured, such as the projectId or API key that is used to interact with the Palette API?
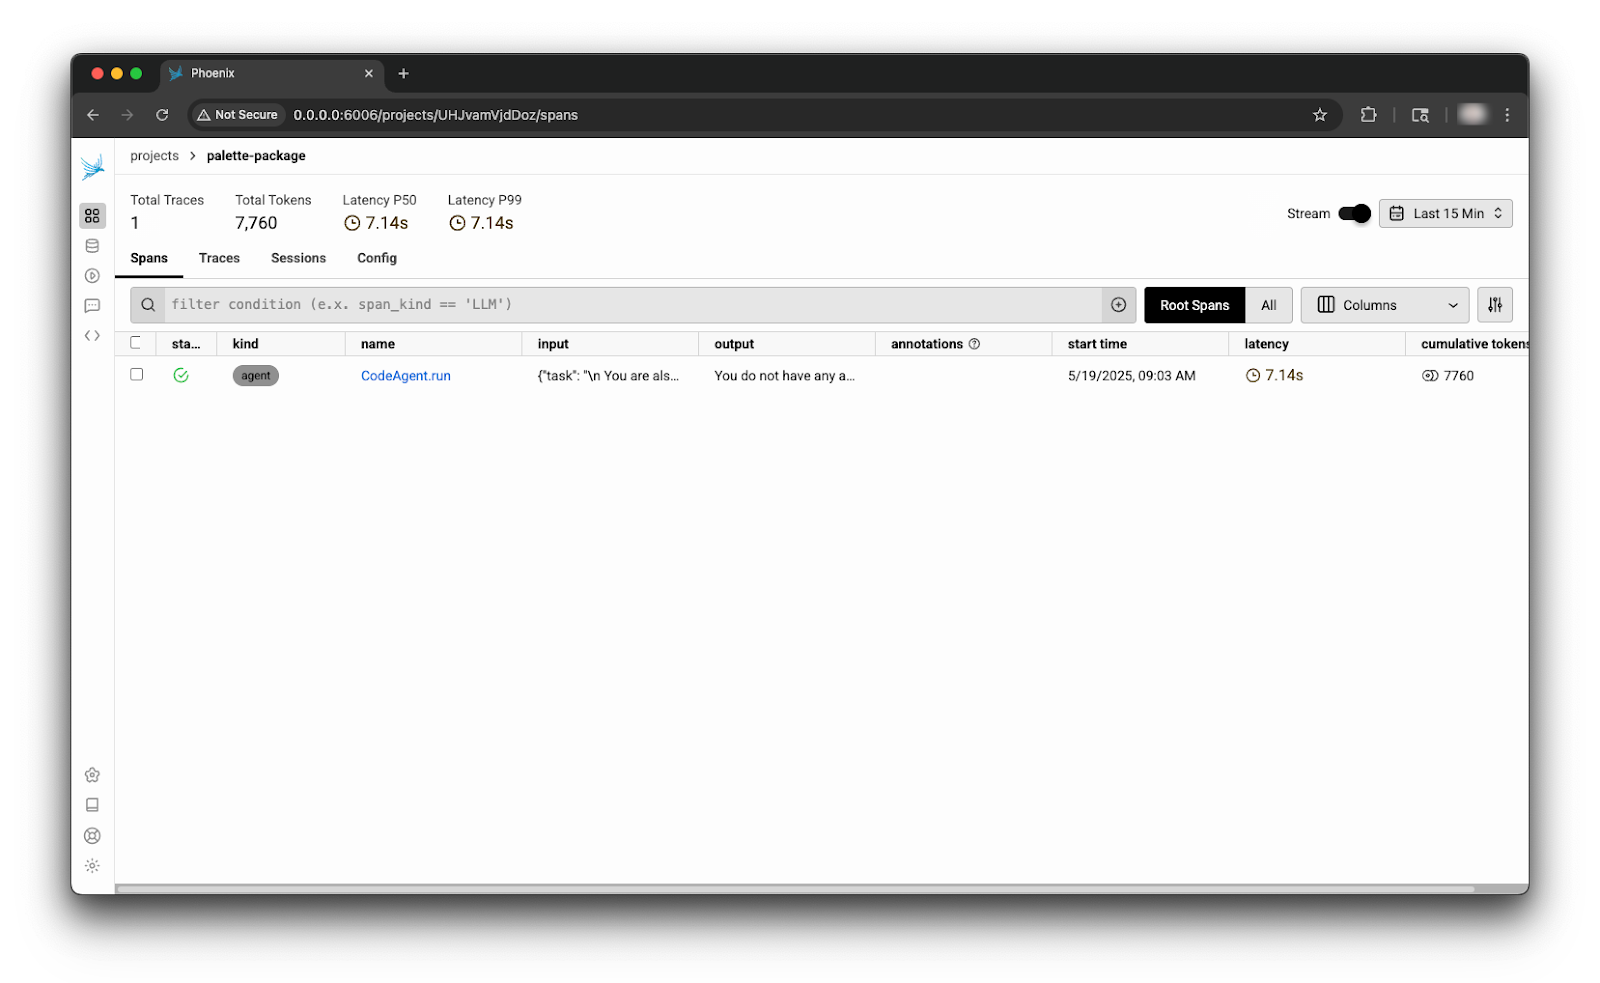
Getting the answer to these questions will most likely explain the incorrect result, or so we hope. To start the investigation, the trace from the main application, palette-package, should be reviewed. A single span is displayed upon clicking on the palette-package card from the dashboard.
Clicking on the span row reveals the chain of events, including the tool calls. There is a lot going on here, so to help you follow along, use the annotated image below.

The first annotated item contains the input received, including the prompt injected in every call to support this example application. The first item checked here is to make sure an API key and project ID is included in the request. The tracing data reveals that an API key and project ID were included. So let’s keep looking.
The next item is the nested spans. You can think of this as the order of operations. The application reached out to the MCP server and used a function call. After the function call, the LLM application processed the tool call results and returned the reply. That’s what’s displayed in item number three.
By clicking on the nested span titled MCPAdapterTool, more information about the tooling call is revealed, such as what went into it, and what was outputted. From the image below, it’s evident that the LLM interpreted the results correctly: the tool function returned an empty list. The function call also received the expected number of parameters, an API key, and a project ID. The span also reveals that the MCP server was registered correctly, along with its available functions.
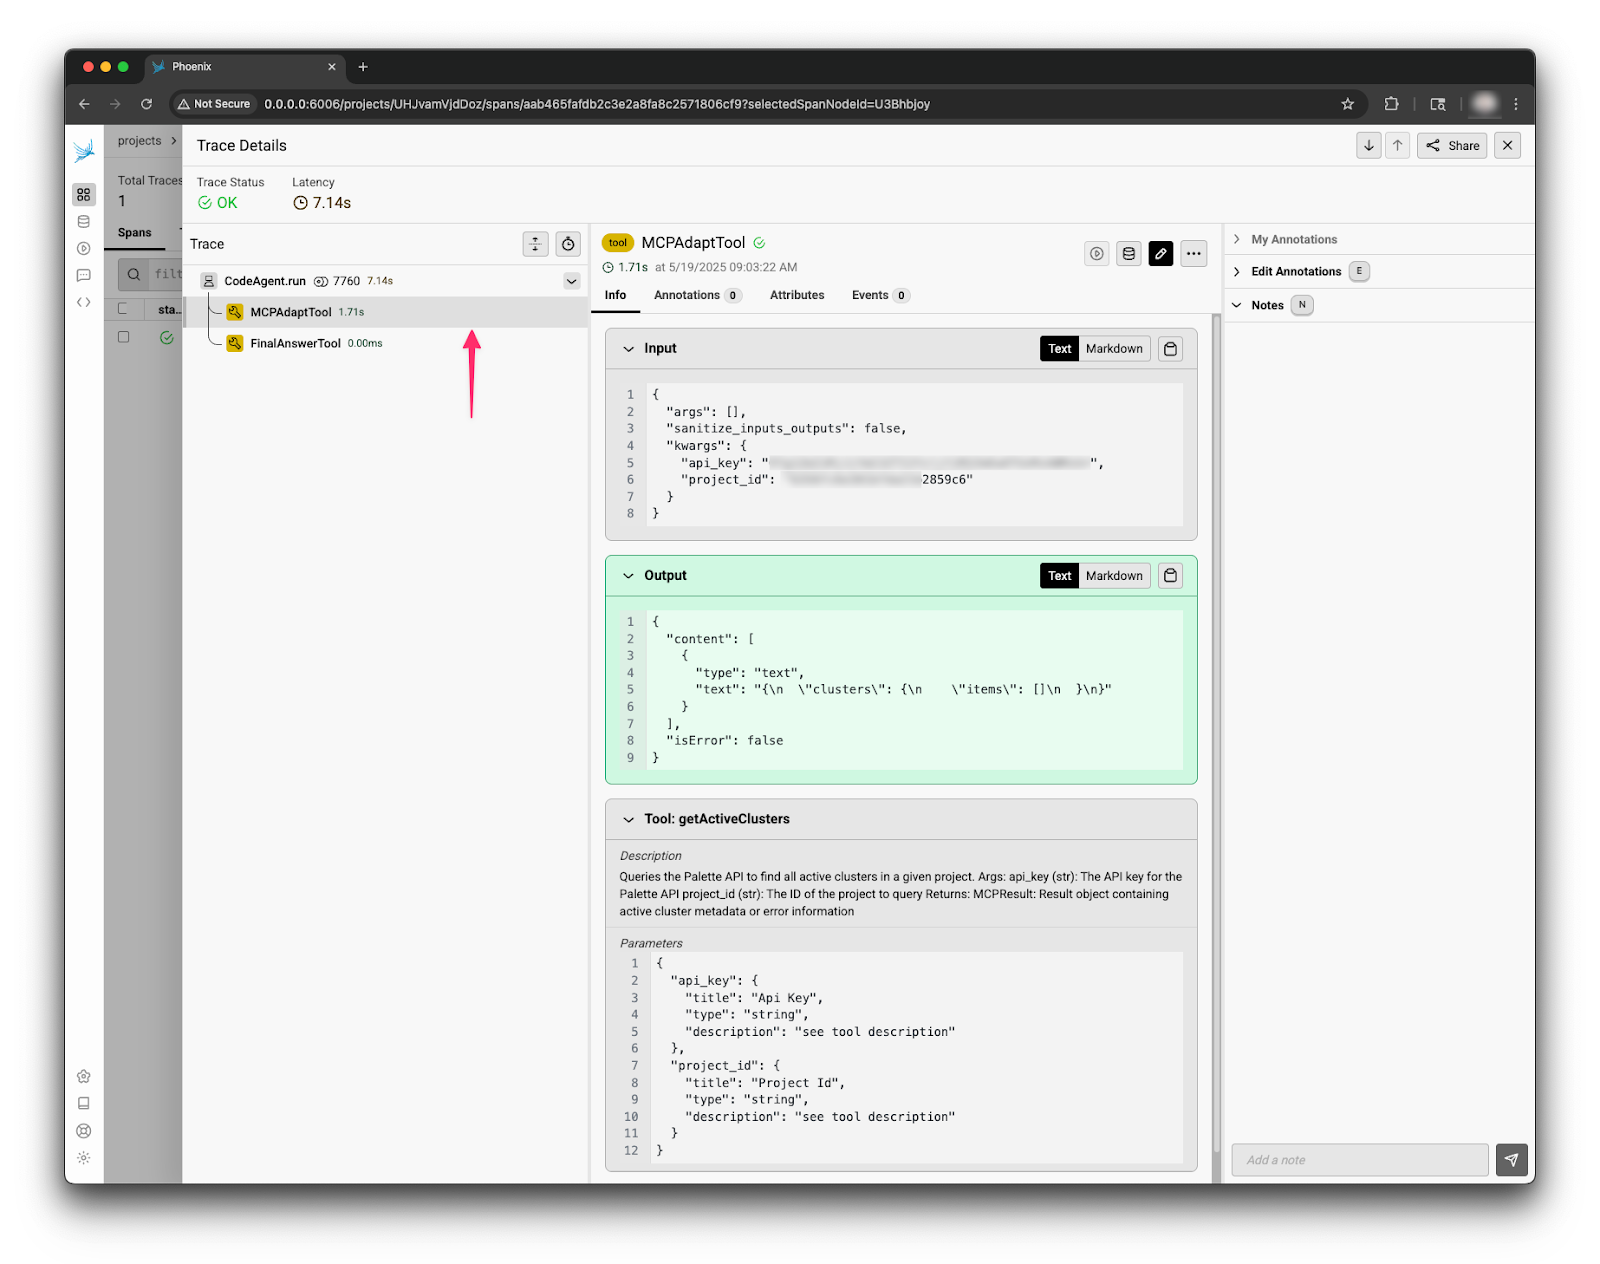
The other important piece of information is that the trace status is a green OK. This means the HTTP request against the Palette API returned a 200 HTTP status code. The MCP server function call was configured to set the trace status using the HTTP return code. This lil trick allows us to get more information from a single span.
Everything uncovered so far leads to us taking a closer look at the input API key and project ID. Upon reviewing the input to the function call, the project ID provided seems a bit off. The ID ends with 2859c6. That does not align with the Palette project of interest. How did the function call get this project ID? Did the LLM make up this project ID? The first view containing the overall input to the application can reveal the answer.

Upon a closer look at the trigger that includes the system prompt, user prompt, and additional context such as AP key and project ID, it’s evident that the application behaved correctly, but received incorrect configurations. The project ID the application received ends with 2859c6 and is not correct. How the incorrect configuration got there is a different story that must be chased up the stack, but from an LLM application perspective, the application can be ruled out as the culprit.
Wrapping up: why observability matters in a ‘black box’ world
Developing agentic applications is challenging due to AI systems' lack of idempotent nature. As we’ve seen, open-source tools like Phoenix by Arize can enable observability in an AI application that gives us clues about what happens inside the ‘black box’.
Thanks to trace data, we safely ruled out a number of possible causes. The AI application was not at fault when the system produced an incorrect output. While our example here is not as complex as you might find in a real-world deployment, it certainly shows the value of adding observability to AI applications.
If you’re developing agentic applications, we strongly suggest you take the time and effort to set up observability. You can get started in minutes and start developing your AI application with a greater level of confidence. That’s what we do here while researching and investigating many different AI use cases.
And one last thing: if you’re running AI workloads on Kubernetes, whether in the data center, cloud or at the edge, we can help you get to the next level. Why not get in touch for a conversation?